Inflationary price increases have resumed for Campbell's Tomato Soup.
Our monthly survey of the prices at which ten major grocery retailers are selling an iconic Number 1 size can of Campbell's Condensed Tomato Soup indicates upward price movement has resumed after stabilizing during the latter half of 2023.
The changes we're observing are significant for U.S. consumers because Campbell Soup (NYSE: CPB) has produced and sold its condensed tomato soup product in this standard 10.75 fluid ounce can continuously since January 1898. Because of that inherent characteristic, its price is not affected by the marketing trick of shrinkflation, in which producers try to hold their shelf prices steady for consumers in the face of sustained inflation by reducing the quantity of goods contained within their packaging. Its price cannot hide the corrosive effects of inflation within the economy.
Here are the prices we're observing in our mid-April 2024 survey along with how they have changed since our January 2024 report:
- Walmart: $1.26/each, unchanged
- Amazon: $1.26/each, decrease of $0.73 (-36.7%)
- Kroger: $1.39/each, increase of $0.10 (+7.8%)
- Walgreens: $1.99/each, unchanged
- Target: $1.39/each, unchanged
- CVS: $2.49/each, increase of $0.60 (+31.7%)
- Albertsons: $1.69/each, increase of $0.20 (+13.4%)
- Food Lion: $1.25/each, unchanged
- H-E-B: $1.31/each, unchanged
- Meijer: $1.29/each, unchanged
We think the most significant price change is the shelf price increase at Kroger-affiliated grocers. The Kroger (NYSE: KRO) family of grocery stores is the largest chain for this category of retailers in the United States. By comparison, Walmart (NYSE: WMT) is a larger retailer, but sells far more categories of consumer goods than just groceries. Together, these two companies sell more cans of tomato soup than many of the other grocers combined.
That includes Amazon, which is the only grocery-selling retailer to decrease their price in this report and which sells far fewer cans of soup than either Walmart or Kroger. Amazon is unusual among our surveyed grocery sellers in having very volatile pricing for Campbell's Condensed Tomato Soup, showing large swings in price from month to month. Our main takeaway in the online retailer's price for a single picnic-size can of Campbell's second-biggest selling soup product is that its April 2024 unit price is not less than $1.26, which is close to the floor among all our surveyed stores.
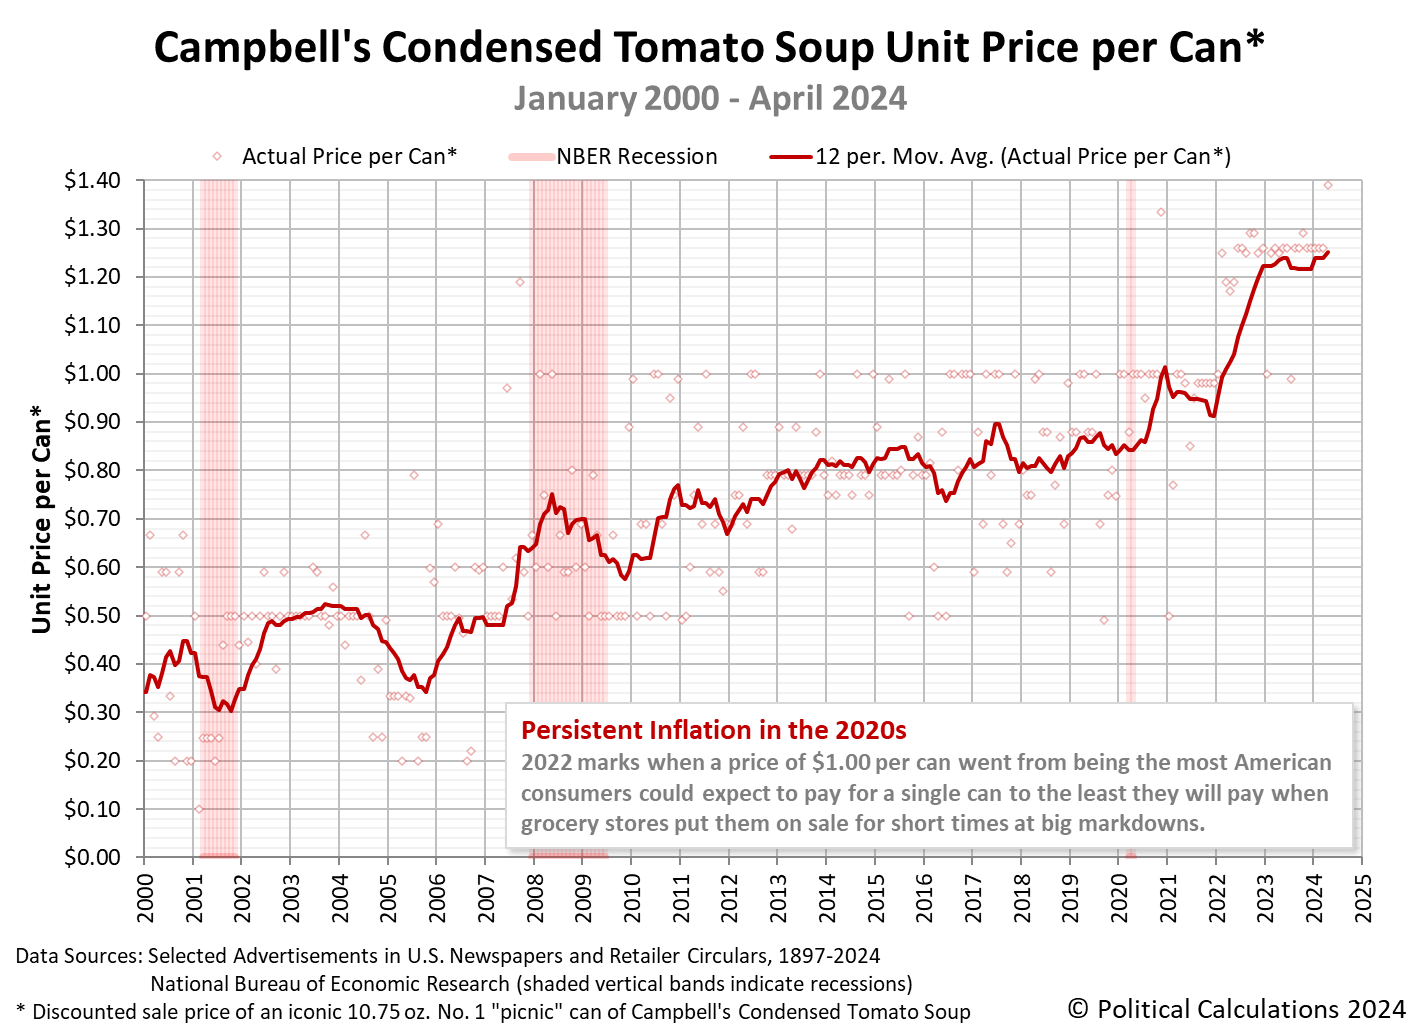
The following chart tracks the changing price of a 10.75 ounce can of Campbell's Condensed Tomato Soup from January 2000 through April 2024. (See this article for a chart visualizing our full price history from January 1898 through January 2024).
The trailing twelve month average price of a single can of Campbell's Condensed Tomato Soup is $1.25 in April 2024. This figure is 30% higher than what it was in March 2021 and is consistent with how overall food prices have changed in the U.S. economy in the period since the current era of elevated inflation began.
Image Credit: Microsoft Copilot Designer. Prompt: "A can of Campbell's Condensed Tomato Soup".
The repercussions of delayed rate cuts continued to shake out in the U.S. stock market in the past week. Overall, the S&P 500 (Index: SPX) dropped a little over 1.5% from where it ended the previous week to close at 5,123.41 on Friday, 12 April 2024.
Most of that decline came on Friday. Bad news came in the form of diminished earning expectations for big U.S. banks, whose previous outlook had counted on the Federal Reserve delivering rate cuts starting before the end of 2024-Q2.
Speaking of which, with the change in outlook for rate cuts, the CME Group's FedWatch Tool now projects the Fed will hold the Federal Funds Rate steady in a target range of 5.25-5.50% until 31 July 2024. The tool also projects just two rate cuts in 2024, one on 31 July (2024-Q3), the other in December (2024-Q4). And a first rate cut on 31 July 2024 is looking shaky.
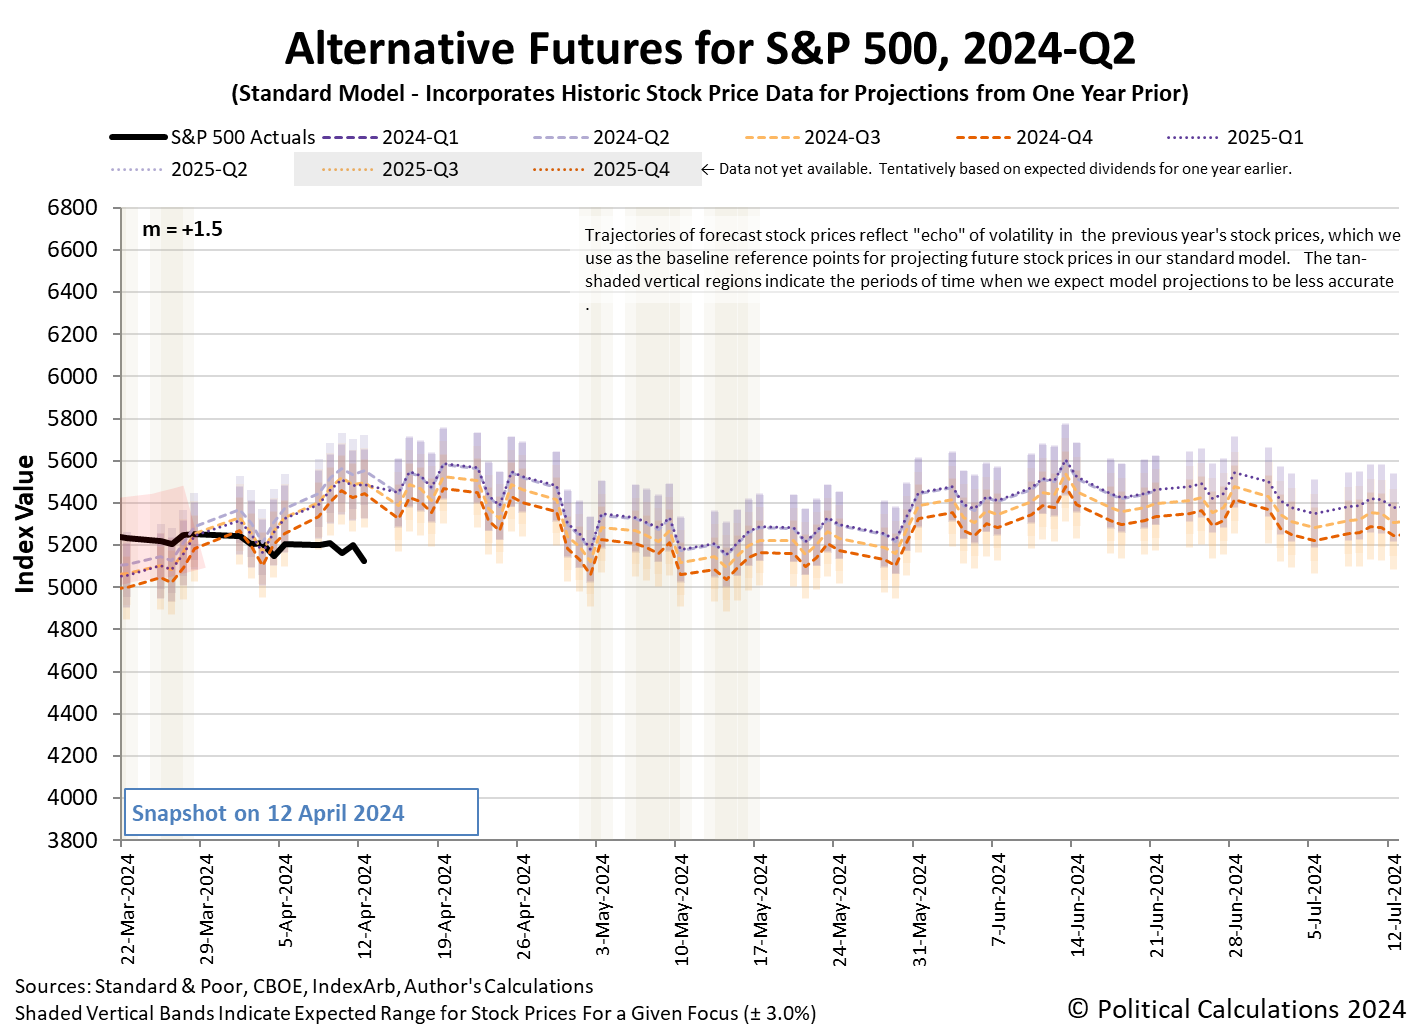
We've rolled the alternative futures chart forward to show the dividend futures-based model's projections for the S&P 500 through the second quarter of 2024.
We find the actual trajectory of the S&P 500 running below the model's projections, with the deviation taking place entirely during the past week. Right now, it's too early to tell if that's a consequence of a regime change in the market, which is on the table because of the change in expectations for the Fed's rate cuts. A regime change would mean the dividend futures-based model's multiplier has itself changed from the value of +1.5 it has mostly held since 9 March 2023. We'll be able to make that determination within the next few weeks.
In the meantime, here are the market-moving headlines from the week that was.
- Monday, 8 April 2024
-
- Signs and portents for the U.S. economy:
- Major food companies offering deals, new sizes as low-income Americans spend less
- Despite $90 crude, US oil output capped by weak natgas prices
- Oil prices dip on Middle East ceasefire talks
- Fed minions worry about "upside inflation":
- 'Upside' inflation risks keep Fed officials wary of turn to rate cuts
- Minneapolis Fed's Kashkari: Central bank can't 'stop short' on inflation fight
- Fed rate cut expectations for 2024 fall to lowest since October
- More stimulus developing in China:
- BOJ minions shocked their attempt to create inflation is working:
- Interest rate cuts developing in the Eurozone:
- Nasdaq, S&P, and Dow, ended unchanged while yields moved up
- Tuesday, 9 April 2024
-
- Signs and portents for the U.S. economy:
- US small-business sentiment slides to lowest level in more than 11 years
- US Postal Service seeks to hike stamp prices to 73 cents
- US Treasury yield forecasts rise as rate cut calls recede
- US Gulf Coast heavy crude oil prices firm as supplies tighten
- Bigger stimulus gaining traction in China:
- BOJ minions say they'll keep money spigots open:
- Bigger trouble developing in Eurozone:
- Nasdaq, S&P end higher in late-session recovery, Dow closes little changed ahead of CPI
- Wednesday, 10 April 2024
-
- Signs and portents for the U.S. economy:
- US consumer prices heat up in March; seen delaying Fed rate cut
- Oil settles higher after Israeli strike overshadows ceasefire talks
- As US bank profits drop, focus shifts to interest income outlook
- Fed seen cutting US interest rates later, and less, as inflation stays hot
- Fed's 'confidence' in disinflation not bolstered by recent data, minutes show
- Fed officials preparing to slow pace of balance sheet runoff
- Fed's rate-cut confidence wobbles as elevated inflation persists
- Fed looks to slice balance sheet runoff pace by half
- Bigger trouble developing in China:
- Fitch downgrades outlook on China to negative, affirms 'A+' rating
- S&P slashes property giant China Vanke's credit rating to junk
- China has been closing idled auto output capacity, industry body says
- BOJ minions want to avoid hiking interest rates for falling yen bailout:
- Wall St ends sharply lower as sticky inflation dims rate cut hopes
- Thursday, 11 April 2024
-
- Signs and portents for the U.S. economy:
- Focus: Soaring insurance costs hit as US buyers finally get a break on car prices
- July start to Fed rate cuts back in view after data
- Fed minions say they are in no hurry to deliver rate cuts, expect trouble for U.S. banks:
- Fed officials in no rush to cut rates as inflation worries rise
- Fed's Williams: Banks should be prepared to use discount window if needed
- Bigger trouble, stimulus developing in China:
- China's Q1 GDP growth set to slow to 4.6%, keeps pressure for more stimulus- Reuters poll
- China's exports likely swung back to contraction in March
- China's weak CPI, factory-gate deflation point to more stimulus
- BOJ and JapanGov minions teaming up to ready bailout for falling yen:
- Japan says it won't rule out any FX action as yen hits 34-year low
- Explainer: Why is the Japanese yen so weak?
- ECB minions getting excited to cut rates in June 2024, claim to be independent from U.S. Federal Reserve, but are they really?
- ECB holds rates at record highs, signals upcoming cut
- ECB puts June rate cut into view, asserts independence from Fed
- Nasdaq, S&P climb, Dow ends flat as investors gear up for earnings season with big banks
- Friday, 12 April 2024
-
- Signs and portents for the U.S. economy:
- Oil settles up on Middle East tensions, posts weekly loss
- US banks' profit picture less clear with cloudy rates trajectory
- Fed minions dial back rate cut expectations, worry about bailing out banks:
- Fed's Daly: absolutely no urgency to cut US interest rates
- Inflation still too high for Fed to cut interest rates, Schmid says
- Exclusive: Fed's Collins eyes about two rate cuts this year
- Less than half of U.S. banks ready to borrow from Fed in emergency
- Bigger trouble developing in China:
- Nasdaq, S&P, Dow end deep in the red as stocks suffer worst session since late January
Any effect on stock prices from Iran's attack on Israel from territory it controls in Iraq over the weekend will be seen in the week ahead.
The Atlanta Fed's GDPNow tool's latest estimate of real GDP growth for the first quarter of 2024 (2024-Q1) ticked down to +2.4% from the +2.5% growth forecast last week.
Image credit: Microsoft Copilot Designer. Prompt: "An editorial cartoon of a Federal Reserve official trying to pull down a sign while a disappointed bull watches"
Solving Sudoku puzzles has become a very popular pastime around the world since the Times of London began publishing them twenty years ago. Although the puzzle itself has been around for much longer, it was its appearance in the Times that prompted its popularity to explode.
The puzzle itself can be described as a kind of simplified crossword puzzle, but with numbers. And maybe not so simple. Sudoku.com sets out the basic rules:
Sudoku is played on a grid of 9 x 9 spaces. Within the rows and columns are 9 “squares” (made up of 3 x 3 spaces). Each row, column and square (9 spaces each) needs to be filled out with the numbers 1-9, without repeating any numbers within the row, column or square.
Sounds simple, right? In practice, how simple a Sudoku puzzle is to solve depends on how many numbers have already been filled in on it. Here's an example of a moderate-to-easy-to solve Sudoku puzzle you can try on your own.
In solving this puzzle, you're taking advantage of Sudoku's rules to fill in the missing numbers. Since each number from 1 to 9 can only appear once in each row and column, and only once in each 3 x 3 box, you can use a process of elimination to identify where the correct digits to solve the puzzle can be placed. For instance, you can probably find the right place to insert a number 9 pretty quickly just by looking at the left-most column, the bottom two rows, and the upper-left 3 x 3 box.
Like crossword puzzles, Sukoku puzzles also have a kind of symmetry to them. It's that symmetry, combined with Sukoku's rules, that offers a way to find the right places to put the missing numbers. You just have to see the secret pattern and that's what the following Numberphile video featring Cracking the Cryptic's Simon Anthony is all about:
Now that you know about the Phistomephel Ring, as this secret pattern hidden in plain sight is called, try using that knowledge to help solve your next Sudoku puzzle.
Image credit: Sudoku Puzzle by L2G-20050714 standardized layout on Wikimedia Commons. Creative Commons CC0 1.0 Universal Public Domain Dedication.
Labels: math
The first quarter of 2024 has come and gone. Along the way, the concentration of carbon dioxide in the Earth's atmosphere has been rising at one of the fastest clips on record.
That observation is a good sign of the extent to which China, the worlds's biggest consumer of coal and the world's biggest producer of carbon dioxide emissions, is pushing to grow its economy.
But China isn't alone in increasing its emissions at such a fast rate. India is also boosting its consumption of coal and its emissions of carbon dioxide to power its economic growth.
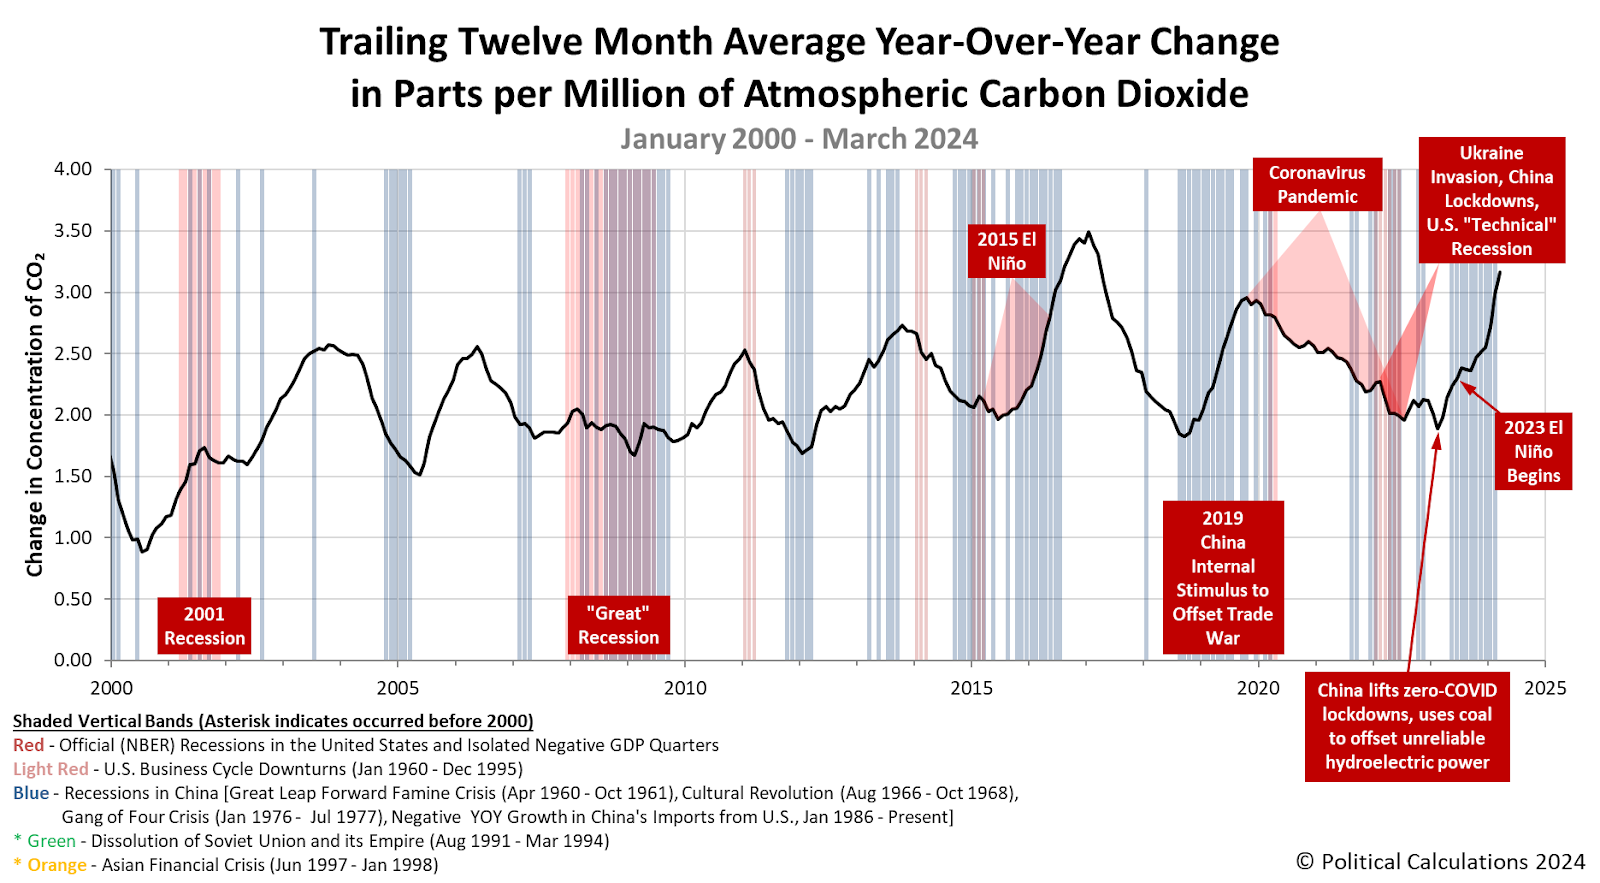
Together, the two most populous nations in the world are leaving their mark on the Earth's atmosphere. That mark can be seen in the rate at which carbon dioxide is being added to the Earth's atmosphere, which we measure as the trailing twelve month average of the year-over-year change in the concentration of CO₂ in the air as measured at the remote Mauna Kea Observatory. The following chart shows how that measure has evolved from January 2000 through March 2024:
The rapid rise in the pace at which carbon dioxide accumulates in the atmosphere during the first quarter of 2024 can be traced to the increased coal consumption of both China and India.
China and India lifted imports of seaborne thermal coal to three-month highs in March as the world's two biggest buyers took advantage of lower international prices of the fuel to meet strong domestic power demand....
For the first quarter, China's seaborne imports of the grade of coal used mainly to generate electricity were 80.64 million tons, up 17.2% from the 68.82 million recorded in the same period in 2023.
The strength in China's imports is being driven by a combination of strong growth in power demand and by seaborne prices being competitive with domestic coal.
Official data showed China's power consumption was 11% higher in January and February this year compared to the same months in 2023, and power generation rose 6.9% in 2023, outpacing the 5.2% growth rate for the economy as a whole.
China's electricity demand is being boosted by a variety of factors, including increasing electrification of the vehicle fleet, higher demand from air conditioners and appliances, and increased electrification of industrial processes, such as some types of smelting.
The article notes China imported some 29.7 million metric tons of coal in March 2024, almost double India's coal imports. India is the world's second-biggest buyer of coal.
Overall, the portion of excess carbon dioxide in the Earth's atmosphere generated by China is on pace to exceed the United States' residual historic CO₂ emissions before the end of the decade.
References
National Oceanographic and Atmospheric Administration. Earth System Research Laboratory. Mauna Loa Observatory CO2 Data. [Online Data]. Updated 5 April 2024.
Image credit: Damn that Smoke (Suzhou, China) by DaiLui on Flickr. Creative Commons CC by 2.0 Deed Attribution 2.0 Generic.
Labels: environment
The total value of goods exchanged between the United States and China rose for the first month since October 2022.
That month marked the beginning of a serious deterioration of trade between the two countries following President Biden's action to restrict the export of advanced semiconductor technology from the U.S. to China. The fallout from President Biden's anti-free trade policies has been worse than the losses that occurred during former President Trump's 2018 tariff war with China prior to the coronavirus pandemic's negative effect on trade.
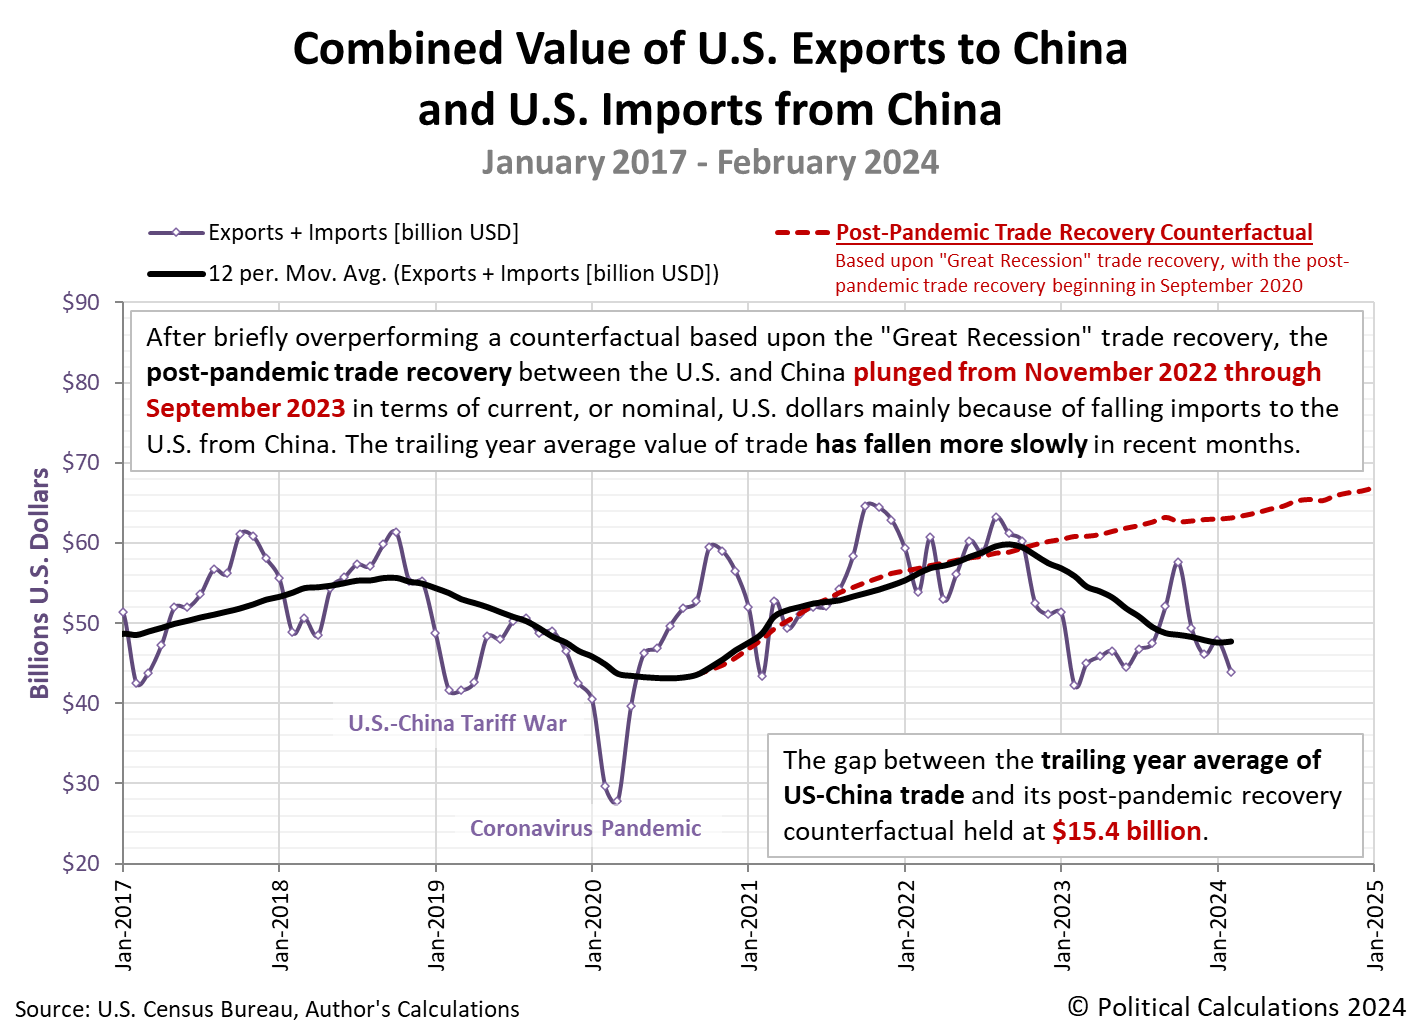
We measure that loss in trade with the trailing twelve month average of the combined value of goods traded between the two countries. In February 2024, the value of that trade ticked up to $47.8 billion from the $47.6 billion recorded in January 2024. The following chart has been updated to show this value for each month from January 2017 through February 2024.
For February 2024, the gap between the trailing year average of US-China trade and its post-pandemic recovery counterfactual held at $15.4 billion, making this month the first since October 2022 in which the gap has not grown.
Unfortunately, President Biden's anti-free trade policies that harm American consumers extend beyond its trade with China. The United States' trade with the rest of the world has likewise declined following President Biden's 2023 State of the Union address, in which he announced expanded "Buy American" anti-free trade measures. That action has greatly diminished trade between the U.S. and its other trading partners, not just China. The next chart shows the gap between the U.S. trade between the rest of the world and its pre-State of the Union counterfactual trendline has widened again in February 2024, even though that trailing twelve month average appears to have hit a bottom in January 2024.
Going back to the trade situation with China, the improvement in US-China trade recorded in February 2024 may be short lived. The Biden administration signaled the expansion of its anti-free trade policies with new restrictions targeting China's exports of so-called green technology products, such as electric vehicles, lithium-ion batteries, and solar energy technologies.
In many ways, Biden's trade policies are becoming a larger rehash of the crony socialism that characterized to the Obama administration's green energy failures. That's why on the cusp of hitting a bottom on its China trade policy, the Biden administration may soon resume digging its hole deeper.
References
U.S. Census Bureau. Trade in Goods with China. Last updated: 4 April 2024.
U.S. Census Bureau. Trade in Goods with World, Not Seasonally Adjusted. Last updated: 4 April 2024.
Image credit: Storage Containers by Peter Griffin on Public Domain Pictures. Creative Commons CCO Public Domain.
Labels: trade
Welcome to the blogosphere's toolchest! Here, unlike other blogs dedicated to analyzing current events, we create easy-to-use, simple tools to do the math related to them so you can get in on the action too! If you would like to learn more about these tools, or if you would like to contribute ideas to develop for this blog, please e-mail us at:
ironman at politicalcalculations
Thanks in advance!
Closing values for previous trading day.
This site is primarily powered by:
CSS Validation
RSS Site Feed
JavaScript
The tools on this site are built using JavaScript. If you would like to learn more, one of the best free resources on the web is available at W3Schools.com.


