Don't you hate it when newspapers have headlines like USA Today's recent "U.S. trade deficit narrows slightly in June on record exports?"
Because regardless of whether you're for or against the free trade of goods and services around the world, that kind of headline is just not going to make you very happy. If you're against free trade, that whole "record exports" thing just flies in the face of your worldview that the U.S. can't successfully produce and sell anything other people in the world want to buy. Meanwhile, if you're in favor of free trade, you know that the words "trade deficit" means that you have to put up with even more demagoguery from the anti-free trade crowd about how those foreigners are winning and Americans are losing.
And because of those demagogues, you know there are people out there just looking to do everything they can to pin the blame somewhere. For example, the USA Today article was accompanied by a graphic that clearly showed that the trade deficit has doubled since George W. Bush was sworn into office in January 2001. We were unable to locate the graphic online, so we've taken the liberty of reproducing it from U.S. Census trade data for imports and exports:
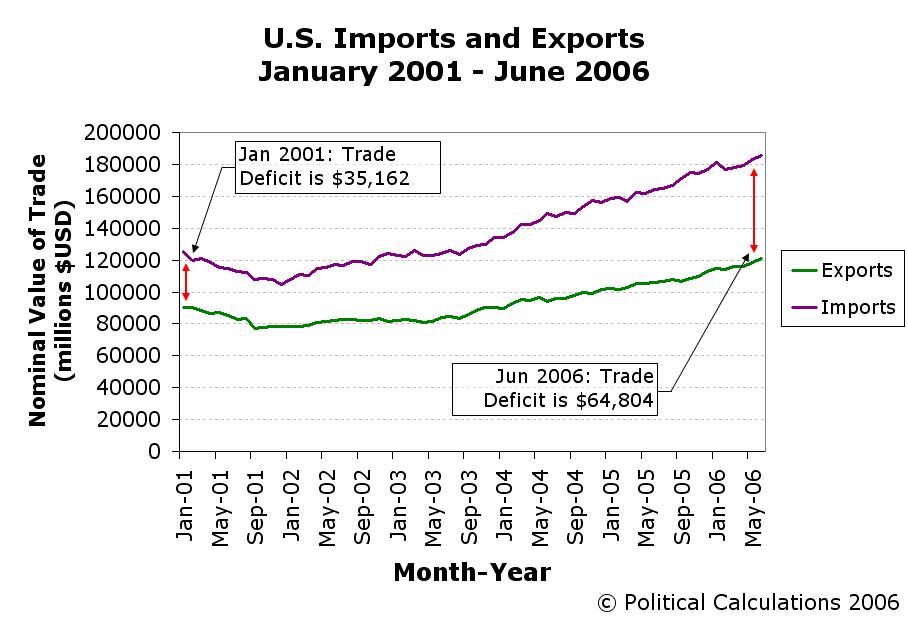
Looks bad, right? It's just as if the current occupant of the White House went out of their way to open up a $29,642 million gap between the value of U.S. imports and exports. But is President Bush responsible for the U.S. trade imbalance?
The problem using charts like this to demagogue the trade issue is that they invariably fail to present historical events in context. Selective use of data, such as the period of recorded data doesn't provide much insight into what was going on either politically or economically during the time in question. How, for instance, did the trade deficit get to $35,162 million when President Bush was sworn into office? What effect did the recession of 2001 have on trade? And so on!
So, returning to our source for the data, let's look at U.S. imports and exports going all the way back to January 2002 - long before the current occupant of the White House assumed office. And while we're at it, let's note some additional relevant events on the chart as well, for the sake of achieving greater clarity:
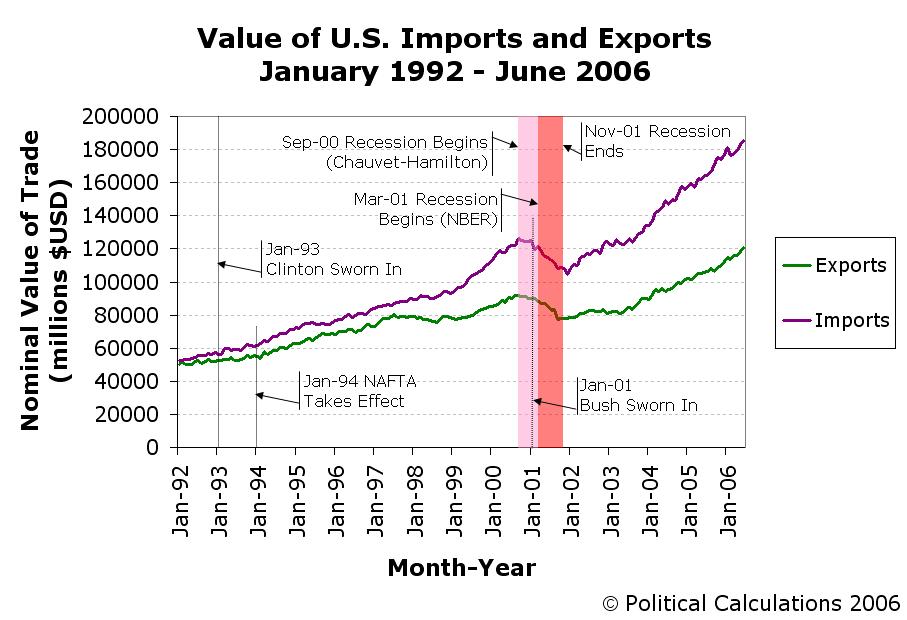
This chart tells us several things. Reading from left to right, we first see that the U.S. trade was very nearly in balance back in January 2002, as the value of imports and exports was nearly equal. Next, we see that the North American Free Trade Agreement between the U.S., Canada and Mexico really had no effect on the overall balance of U.S. trade.
Then, we get to where it really gets interesting. Beginning in mid-1997, the U.S. trade deficit really began to widen. We next see that both imports and exports declined in step with the decline in overall U.S. economic activity during the recession of 2001.
Finally, we see that following the recession of 2001, the growth of U.S. exports lagged the growth of U.S. imports until mid-2003. Although not indicated on the chart, this may be explained by the September 11, 2001 terrorist attack upon the U.S. and the corresponding negative effect it had on the world's air transport industry (we chose not to present this information on the chart given the congestion of events around the 2001 recession.)
Since aerospace products, such as commerical jetliners, represent such a major part of U.S. exports, this single factor largely accounts for the widening of the trade deficit in recent years. Otherwise, the growth of the U.S. trade deficit has largely moderated from when it boomed during the second term of the Clinton presidency.
We'll take a closer look at all this in upcoming days....
Labels: trade
Welcome to the blogosphere's toolchest! Here, unlike other blogs dedicated to analyzing current events, we create easy-to-use, simple tools to do the math related to them so you can get in on the action too! If you would like to learn more about these tools, or if you would like to contribute ideas to develop for this blog, please e-mail us at:
ironman at politicalcalculations
Thanks in advance!
Closing values for previous trading day.
This site is primarily powered by:
CSS Validation

RSS Site Feed
JavaScript
The tools on this site are built using JavaScript. If you would like to learn more, one of the best free resources on the web is available at W3Schools.com.
Other Cool Resources
Blog Roll


